
KPI Scorecard Software for Franchise Performance Management
Autymate helps franchisors and multi-location teams track every location in one scorecard. Compare KPIs against goals, spot profit leaks, and turn red metrics into clear next steps.
What Is KPI Scorecard Software?
KPI scorecard software helps businesses track key performance indicators against goals, benchmarks, and targets. It shows whether each metric is on track, near goal, or behind goal, so leaders can quickly understand what needs attention.
For franchisors and multi-location businesses, KPI scorecard software helps compare locations, monitor financial performance, identify profit leaks, and create accountability across teams.
Autymate’s KPI scorecard software is built for franchise and multi-location performance management. It connects data from QuickBooks and other business systems, scores every location against goals, highlights red metrics, and helps teams assign actions to improve results.
Everything Your KPI Scorecard Does
Autymate brings KPI tracking, franchise reporting, financial performance, benchmarking, and AI-powered action planning into one scorecard. Instead of switching between spreadsheets, dashboards, accounting reports, and disconnected systems, your team can see what is happening, why it matters, and what needs to happen next.
See Your Entire Franchise Network at a Glance
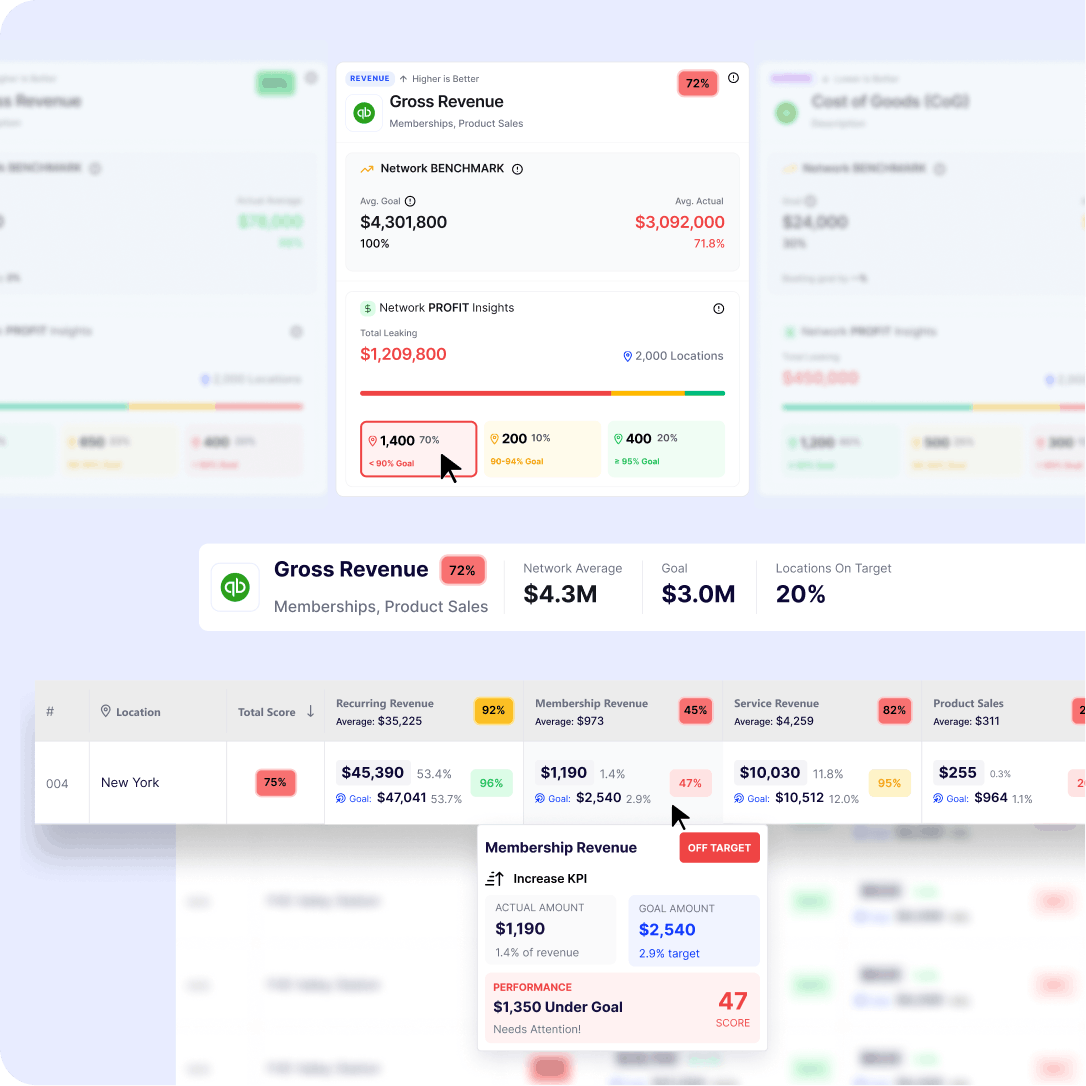
Autymate gives franchisors and multi-location operators a clear view of performance across the full network. Every location is scored against its goals and benchmarked against the network, so you can instantly see which locations are behind goal, near goal, or on track.
Instead of reviewing one spreadsheet at a time, leadership can see total profit leakage, performance distribution, and the locations that need attention in one view.
- Behind Goal
- Locations below the required threshold and needing immediate action.
- Near Goal
- Locations close to target but still worth monitoring.
- On Track
- Locations meeting or beating the defined KPI goal.


- Every Location
- Each location is measured against its goal and network average.
- One Standard Chart of Accounts
- Metrics like net income, revenue, and expenses stay consistent across every location.
- Priced in Dollars
- Each KPI gap is quantified in dollars so teams understand the real financial impact.
Filter to the Locations That Matter
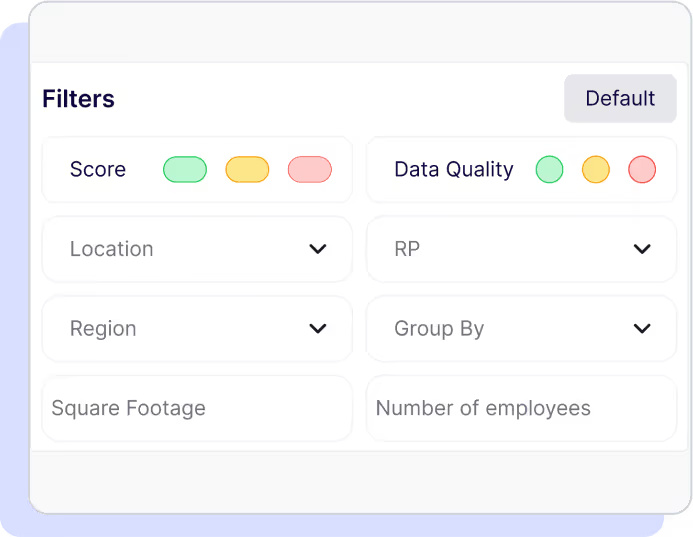
Seeing the whole network is useful. Filtering it is how teams take action. Autymate lets you narrow your KPI scorecard by hierarchy, region, brand, location, score, date range, team, data quality, or custom attributes, so the right issues surface quickly.
Use filters to find underperforming locations, compare similar stores, review regional trends, and prioritize the actions most likely to improve performance.
Top performers become your playbook. Bottom performers become your priority list.
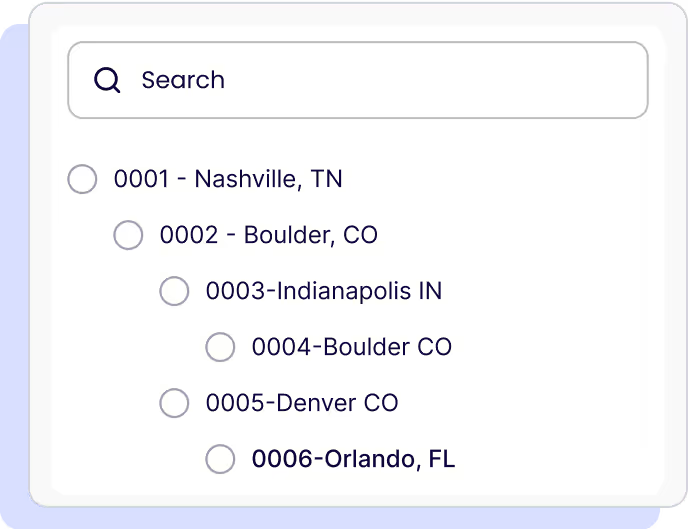
Roll Up by Hierarchy
Group locations by region, brand, district, or ownership structure so franchisors can review performance at the right level.
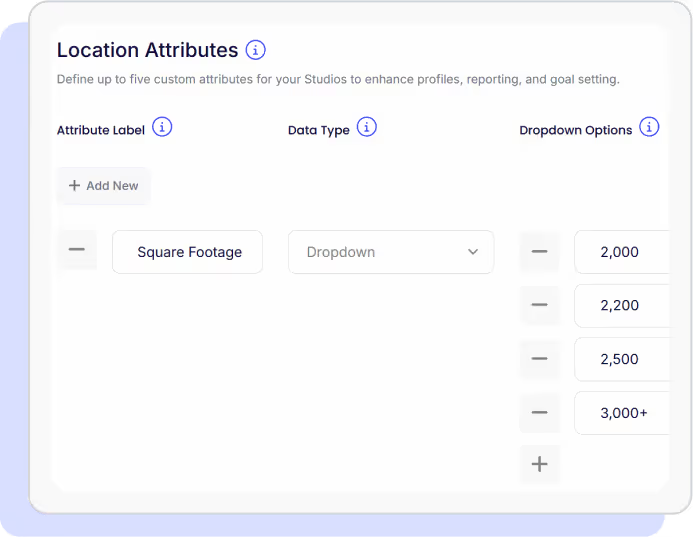
Define Your Own Attributes
Create attributes such as square footage, headcount, ownership group, location type, or market so benchmarking becomes more accurate.
From a Red KPI to the Transaction Behind It
A red KPI should not leave your team guessing. In Autymate, you can click an underperforming metric and move from the network view to the location, from the location to the metric, and from the metric to the transaction-level detail behind the number.
This gives finance, operations, and franchise teams a clear path from problem to root cause. You can see whether the issue is tied to revenue, food cost, labor, expenses, bookkeeping gaps, or a specific invoice or journal line. No exports. No manual report pulling.
- 01NetworkEvery location, scored
↳ Downtown is red →
- 02Location: DowntownIts KPIs against goal
↳ Food Cost is the cause →
- 03Metric: Food Cost %Actual vs. goal, the dollar gap
↳ Trace the spend →
- 04TransactionDown to the journal line


Red Metric? Get the Strategy. Assign It.
Autymate does more than show what is wrong. When a KPI falls behind goal, the AI Growth Advisor recommends a strategy, assigns the next step, and tracks progress until performance improves.
- MetricSpot the KPI behind goal.
- StrategyGet an AI-recommended fix.
- ActionAssign the next step.
- ExecutionTrack ownership and progress.
- GoalMove the KPI back on target.
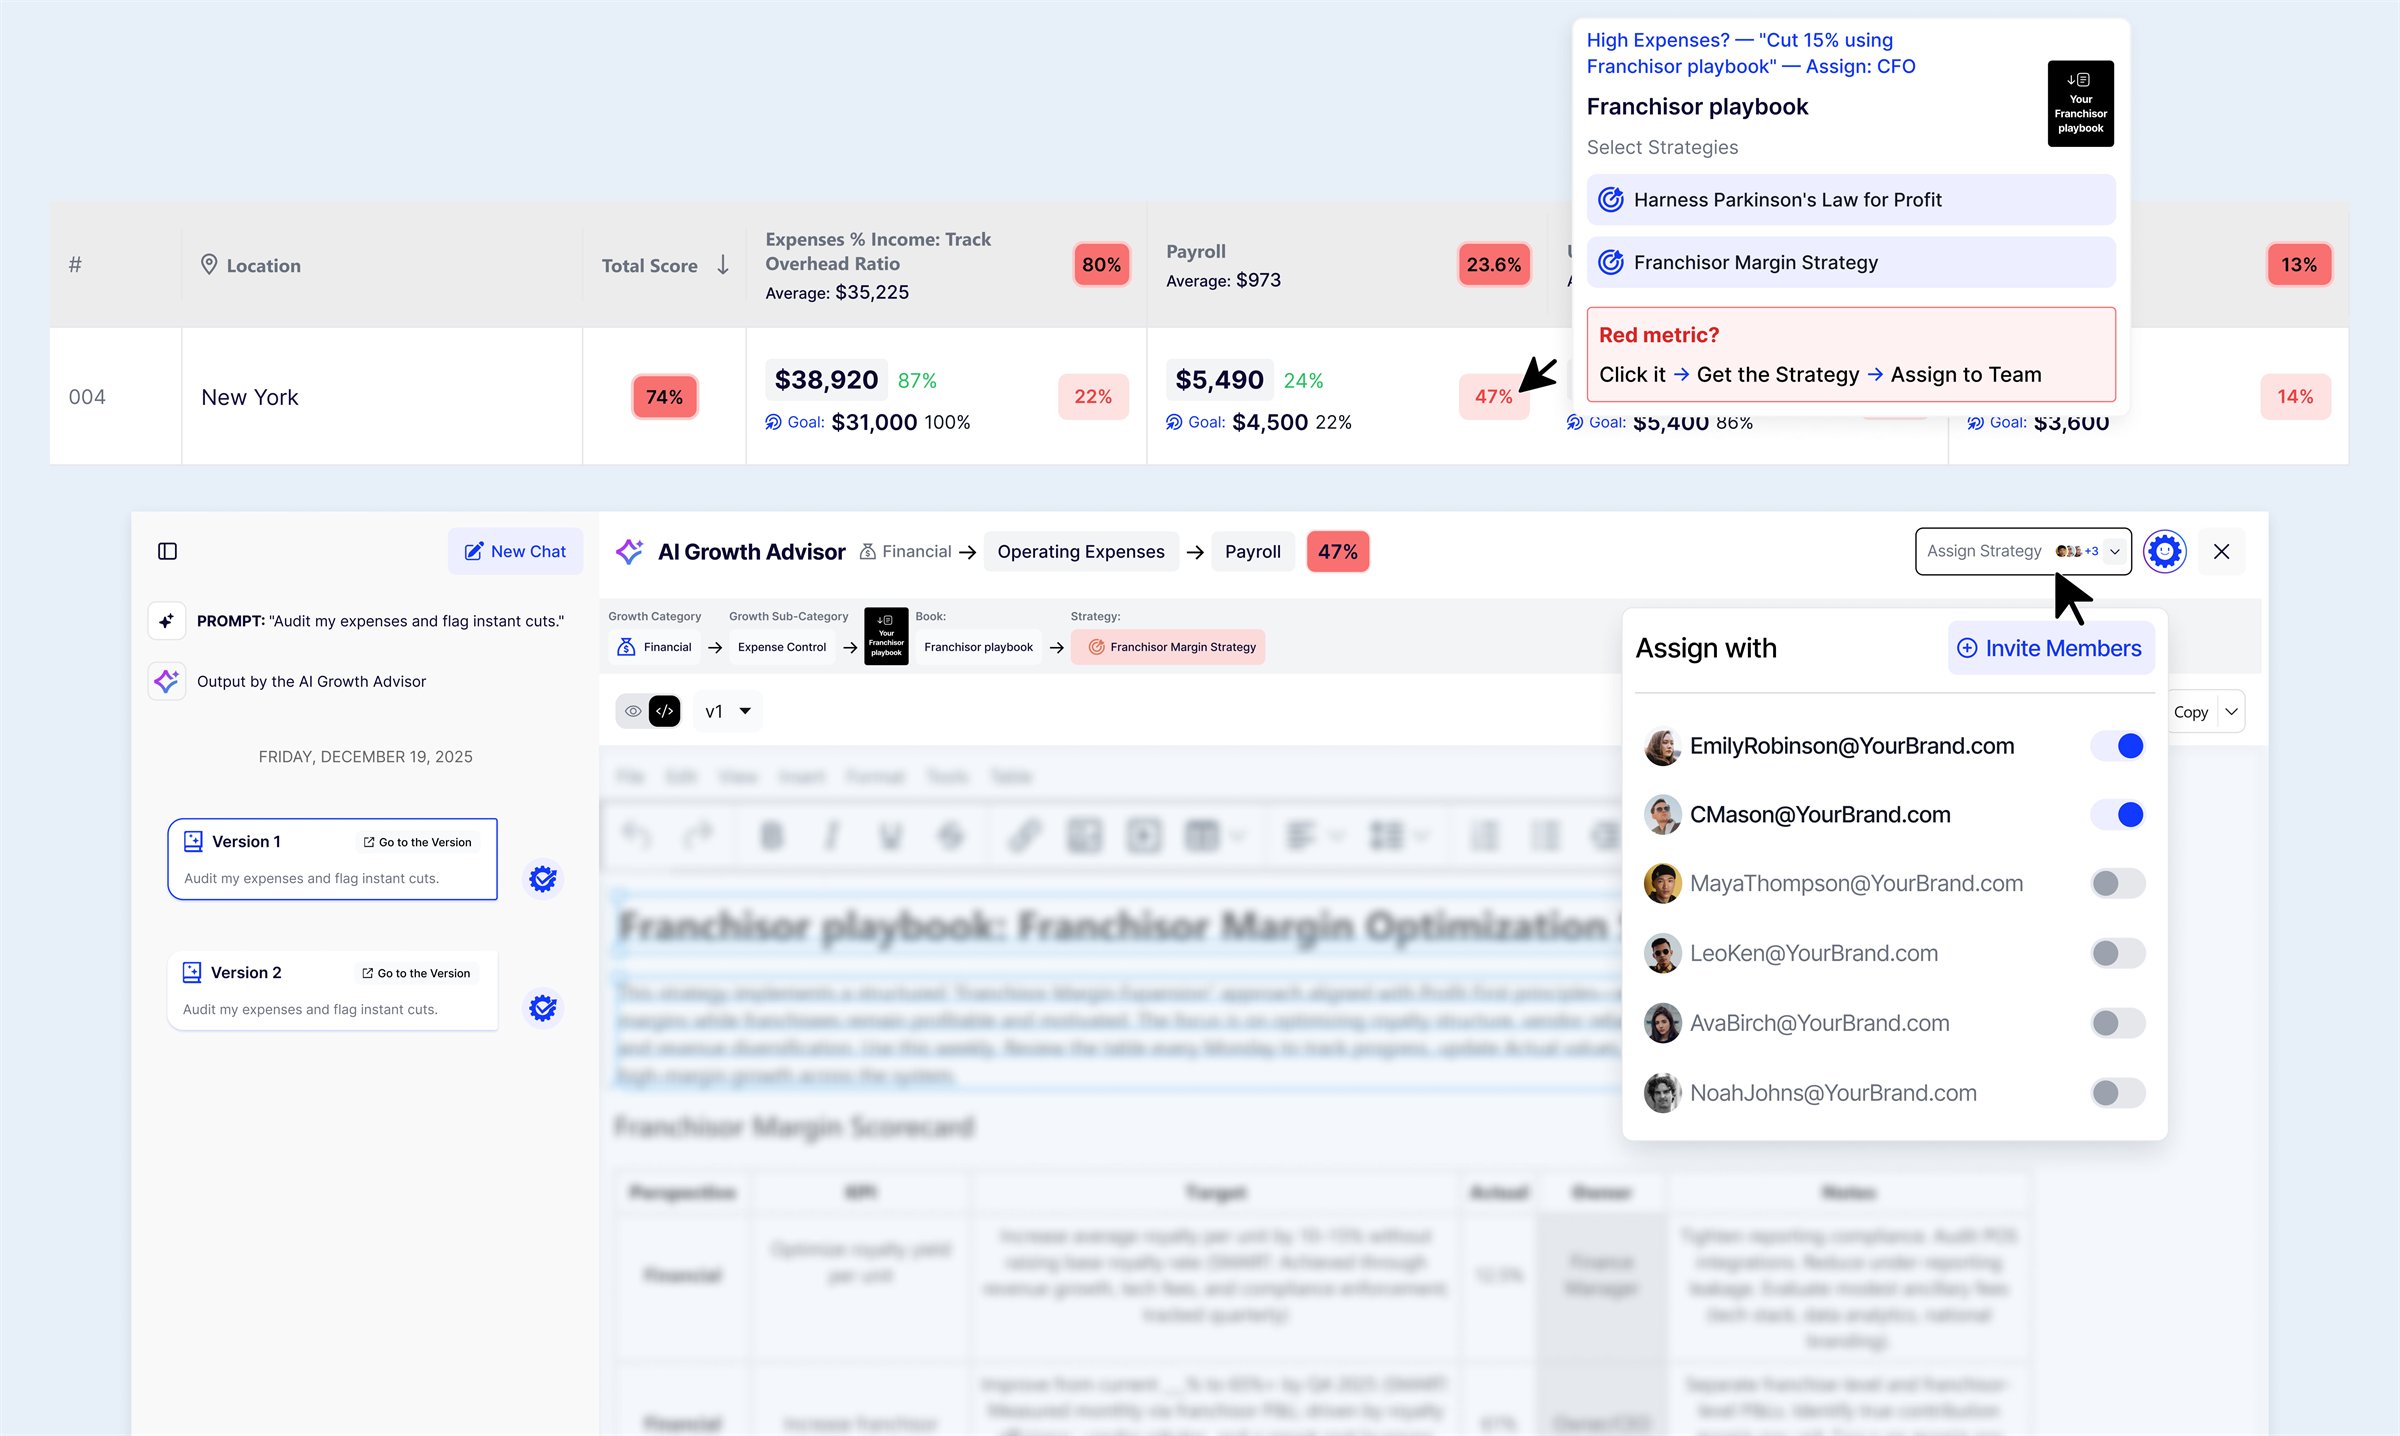
Franchisors pull from a Franchisor Playbook: network-wide fixes the AI Growth Advisor deploys when a location falls behind, assigned to a named owner and tracked to goal. Meet the AI Growth Advisor.
Every Financial KPI, Scored Against Goal
Autymate helps franchise and multi-location teams track the financial KPIs that matter most. Revenue, cost of goods sold, operating expenses, four-wall profitability, AR aging, and cash-related metrics can all be scored against defined goals for each location.
Each KPI uses simple red, yellow, and green status indicators, so teams can see which numbers are healthy, which are close to target, and which need immediate action.
- Revenue
- Track sales performance and compare actual revenue against target.
- Cost of Goods Sold
- Monitor COGS percentage and identify where product costs are affecting margins.
- Operating Expenses
- Review expense performance across locations and spot spending issues.
- Four-Wall Profitability
- Understand whether each location is profitable before corporate overhead and royalties.
- AR Aging
- Track overdue balances and monitor collection risk.
Four-wall profitability is what a single location earns after the costs it controls, before corporate overhead and royalties. It’s the truest read on whether a unit is profitable on its own four walls.
Build Any KPI Metric, Five Ways
Each metric carries its own goal, owner, and a choice of six visualizations (number, gauge, line, area, pie, progress bar).
Library
Use pre-built metrics from connected apps, including QuickBooks and financial reporting metrics.
Standardized Chart of Accounts
Keep revenue, expenses, net income, and other financial categories consistent across locations.
Custom
Build a KPI from connected data using your own aggregation and dimension.
Calculated
Combine multiple metrics to create ratios, margins, percentages, or custom scores.
Manual
Enter values by hand for business KPIs that do not come from a connected system.
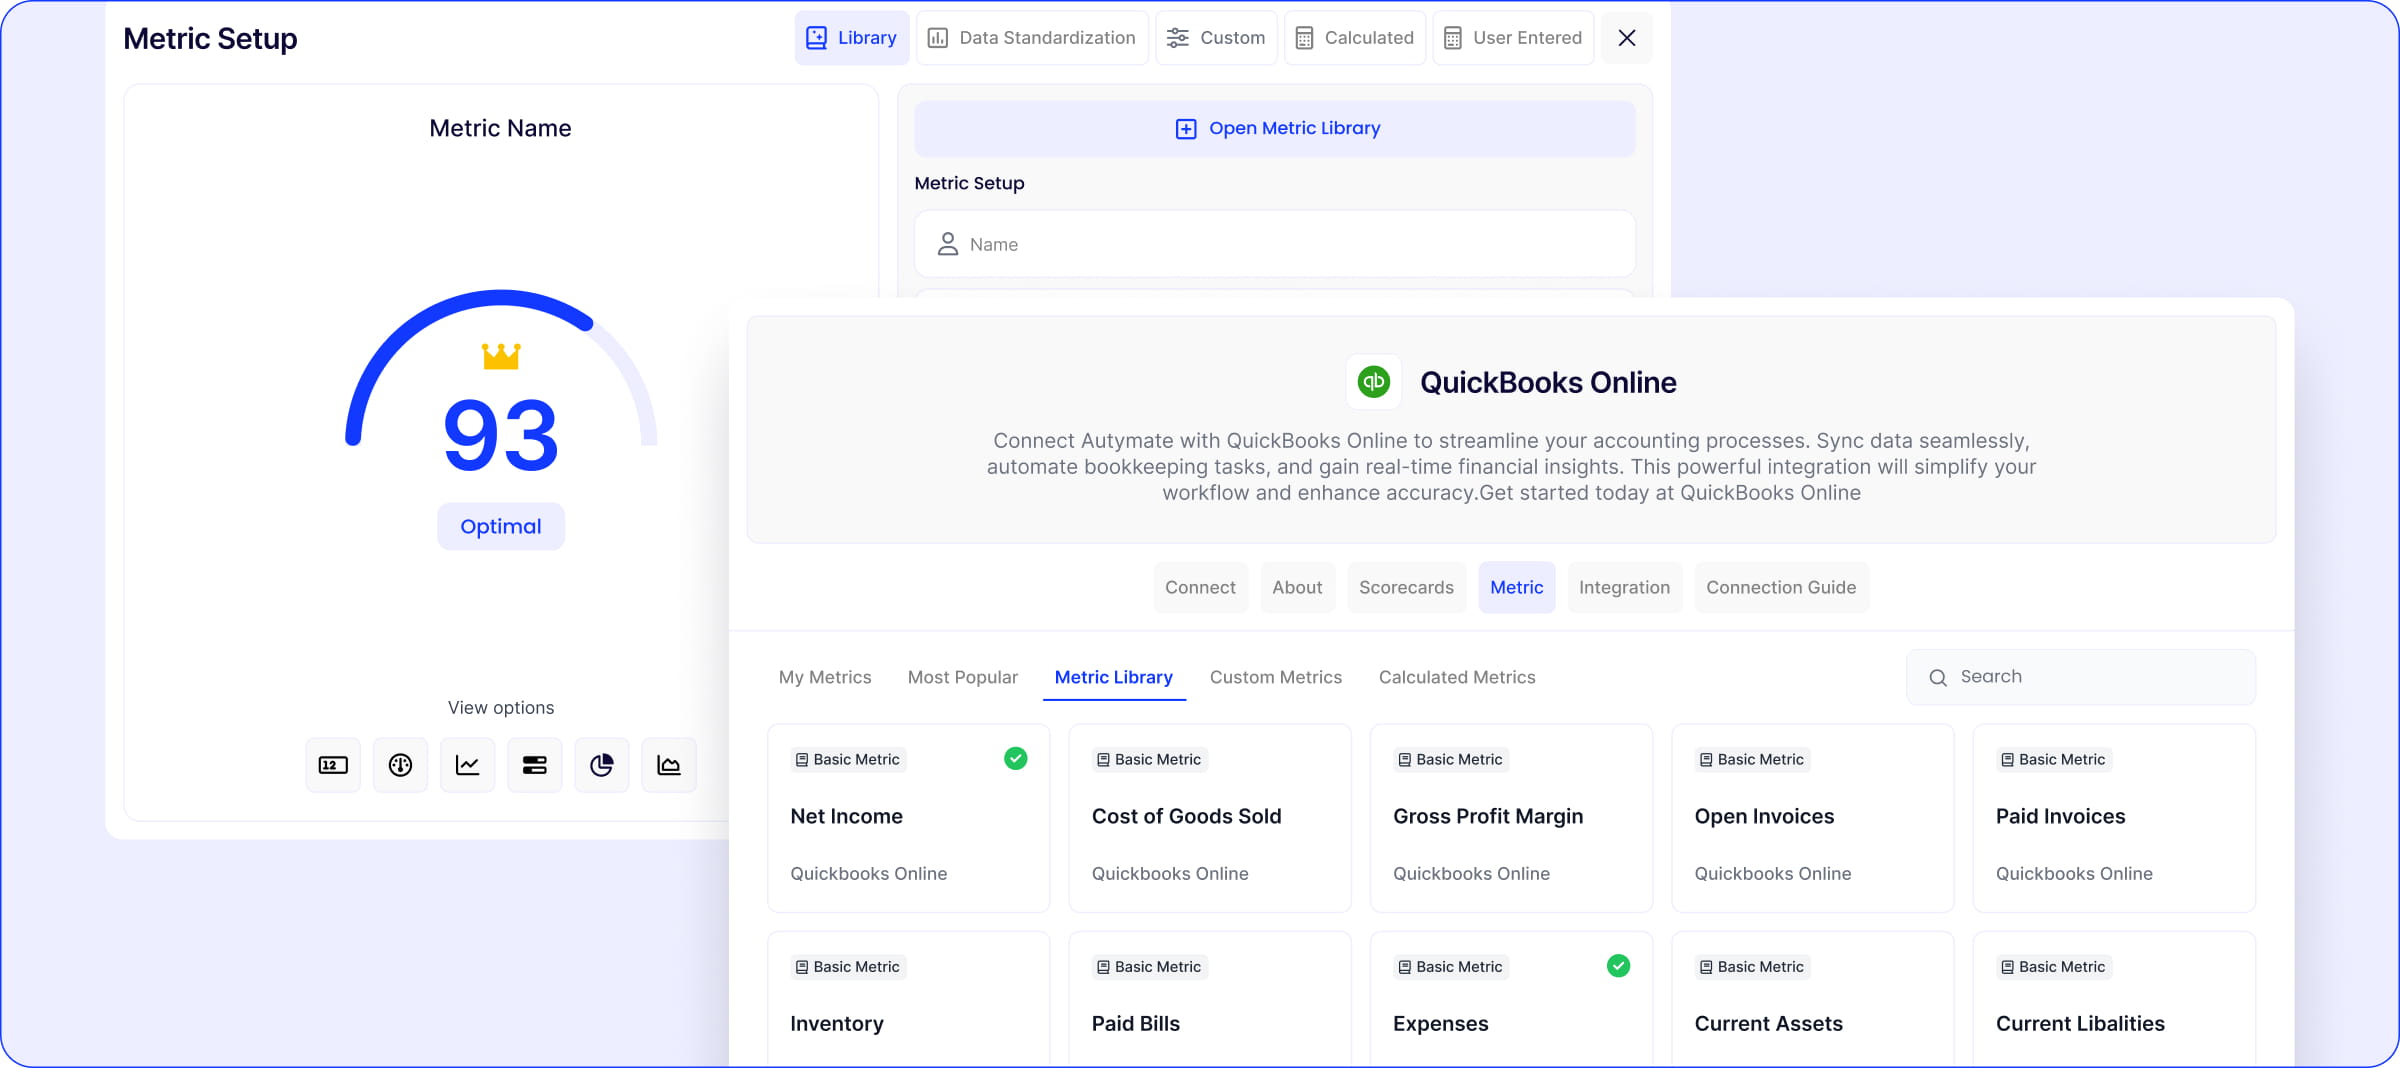
Five Ways to View the Same KPI Scorecard
Different teams need different views of the same performance data. Autymate lets you view the same KPI scorecard by unit, dashboard, team, period, or map, so each leader can answer the right question without rebuilding reports.
Switch between goal vs. actual performance, location rankings, budget comparisons, previous-period trends, and geographic views in a few clicks.
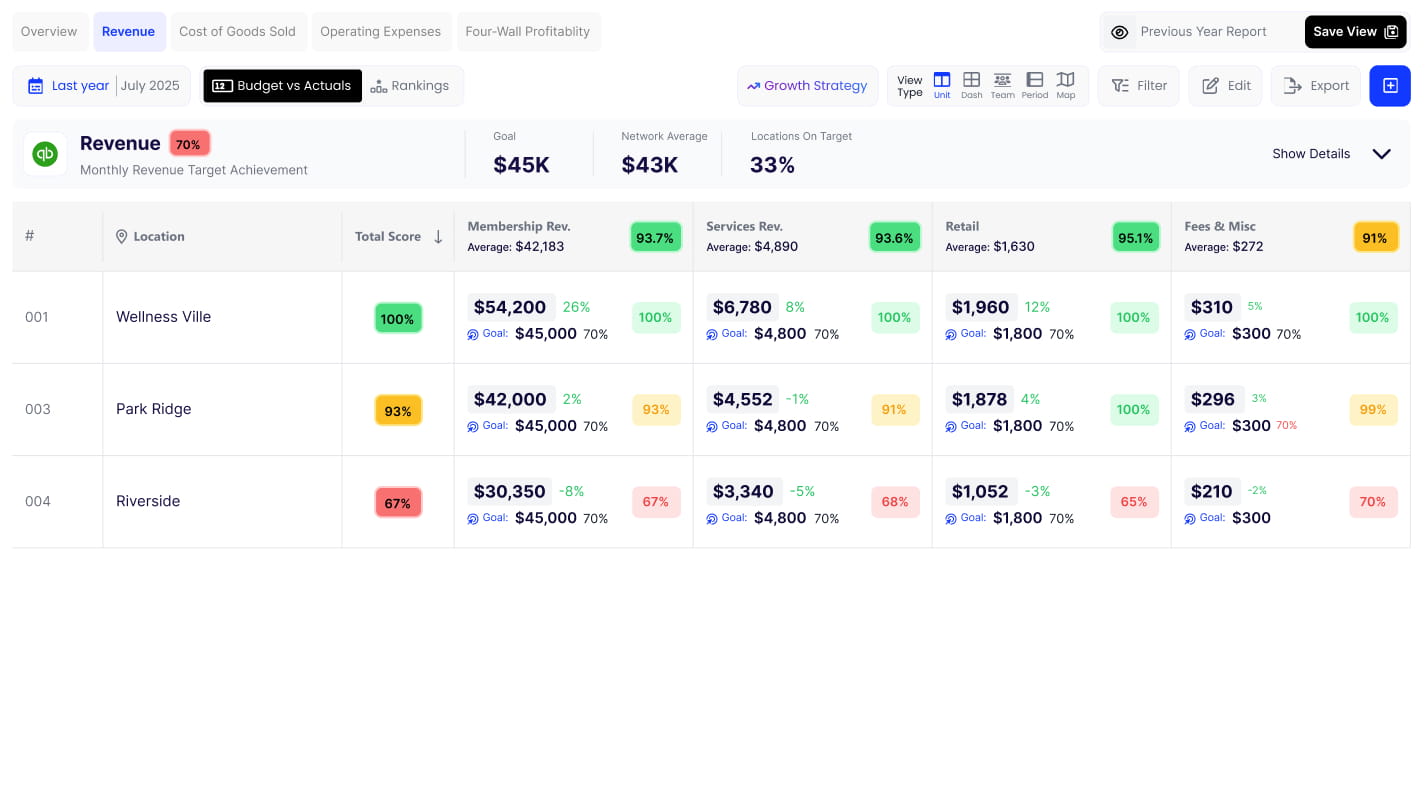
Unit ViewEvery KPI, every location, in depth. 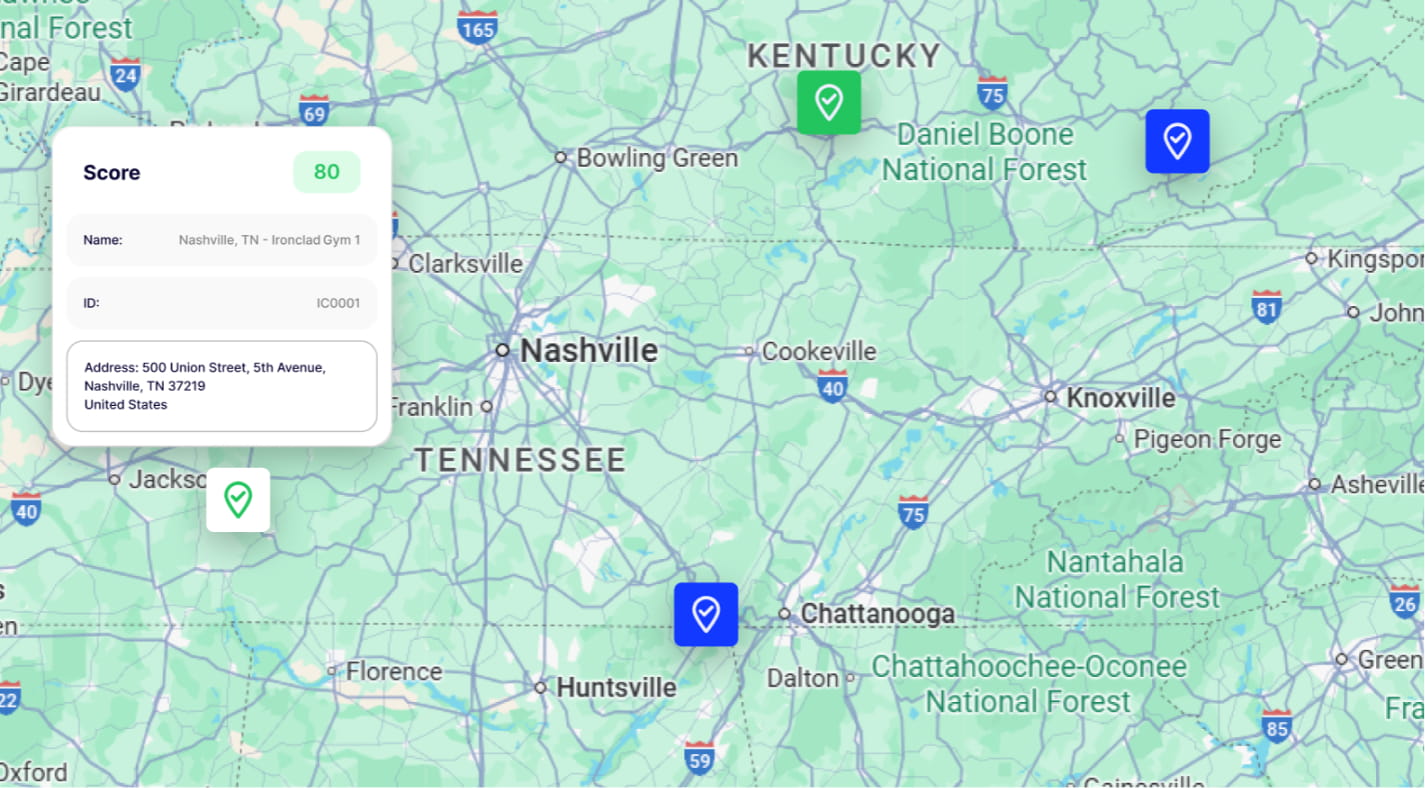
Map ViewPerformance across geography. 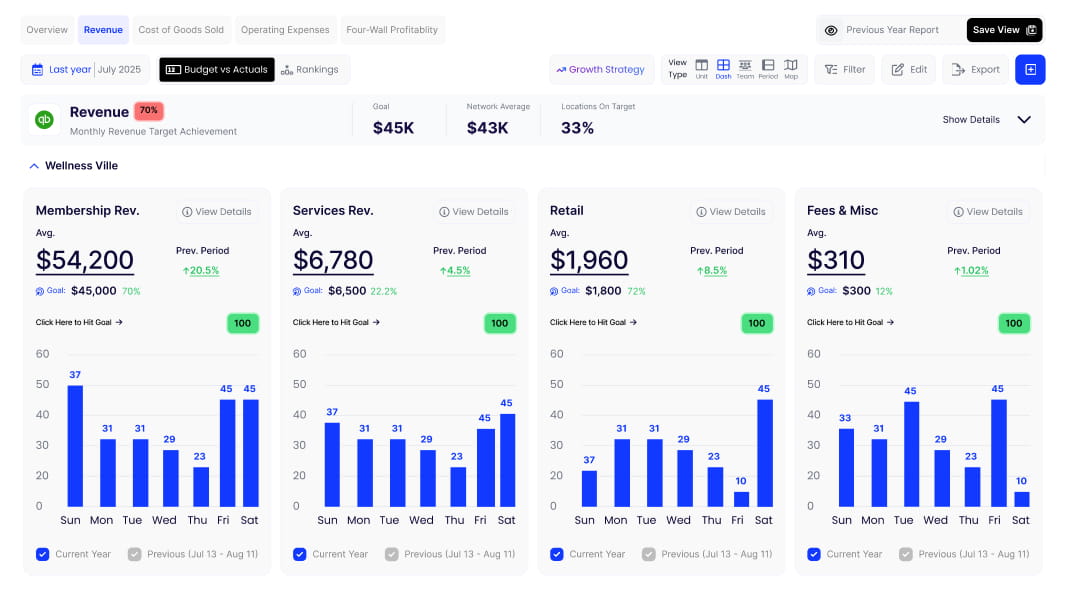
Dashboard ViewKPI trends and goals, visualized. 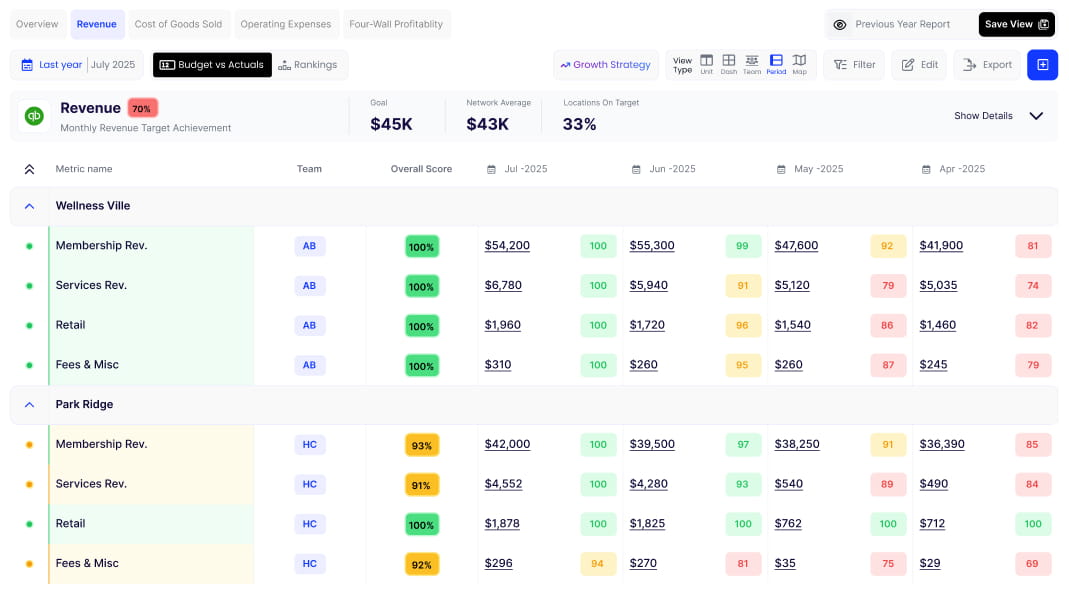
Period ViewThis period vs. last, vs. budget. 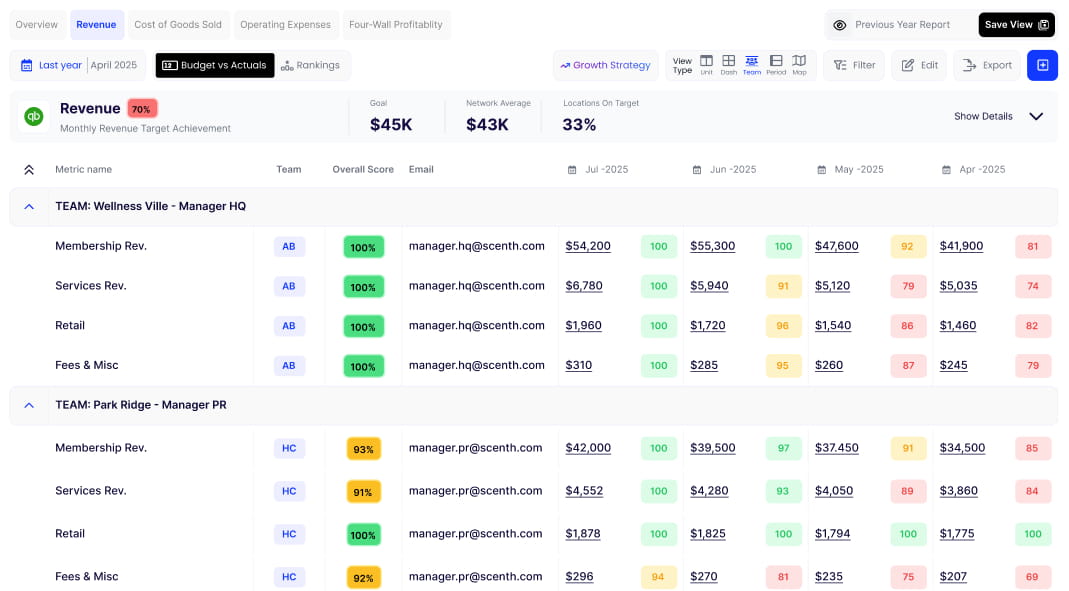
Team ViewGrouped by who owns the numbers.
Built for Franchisors and Franchisees
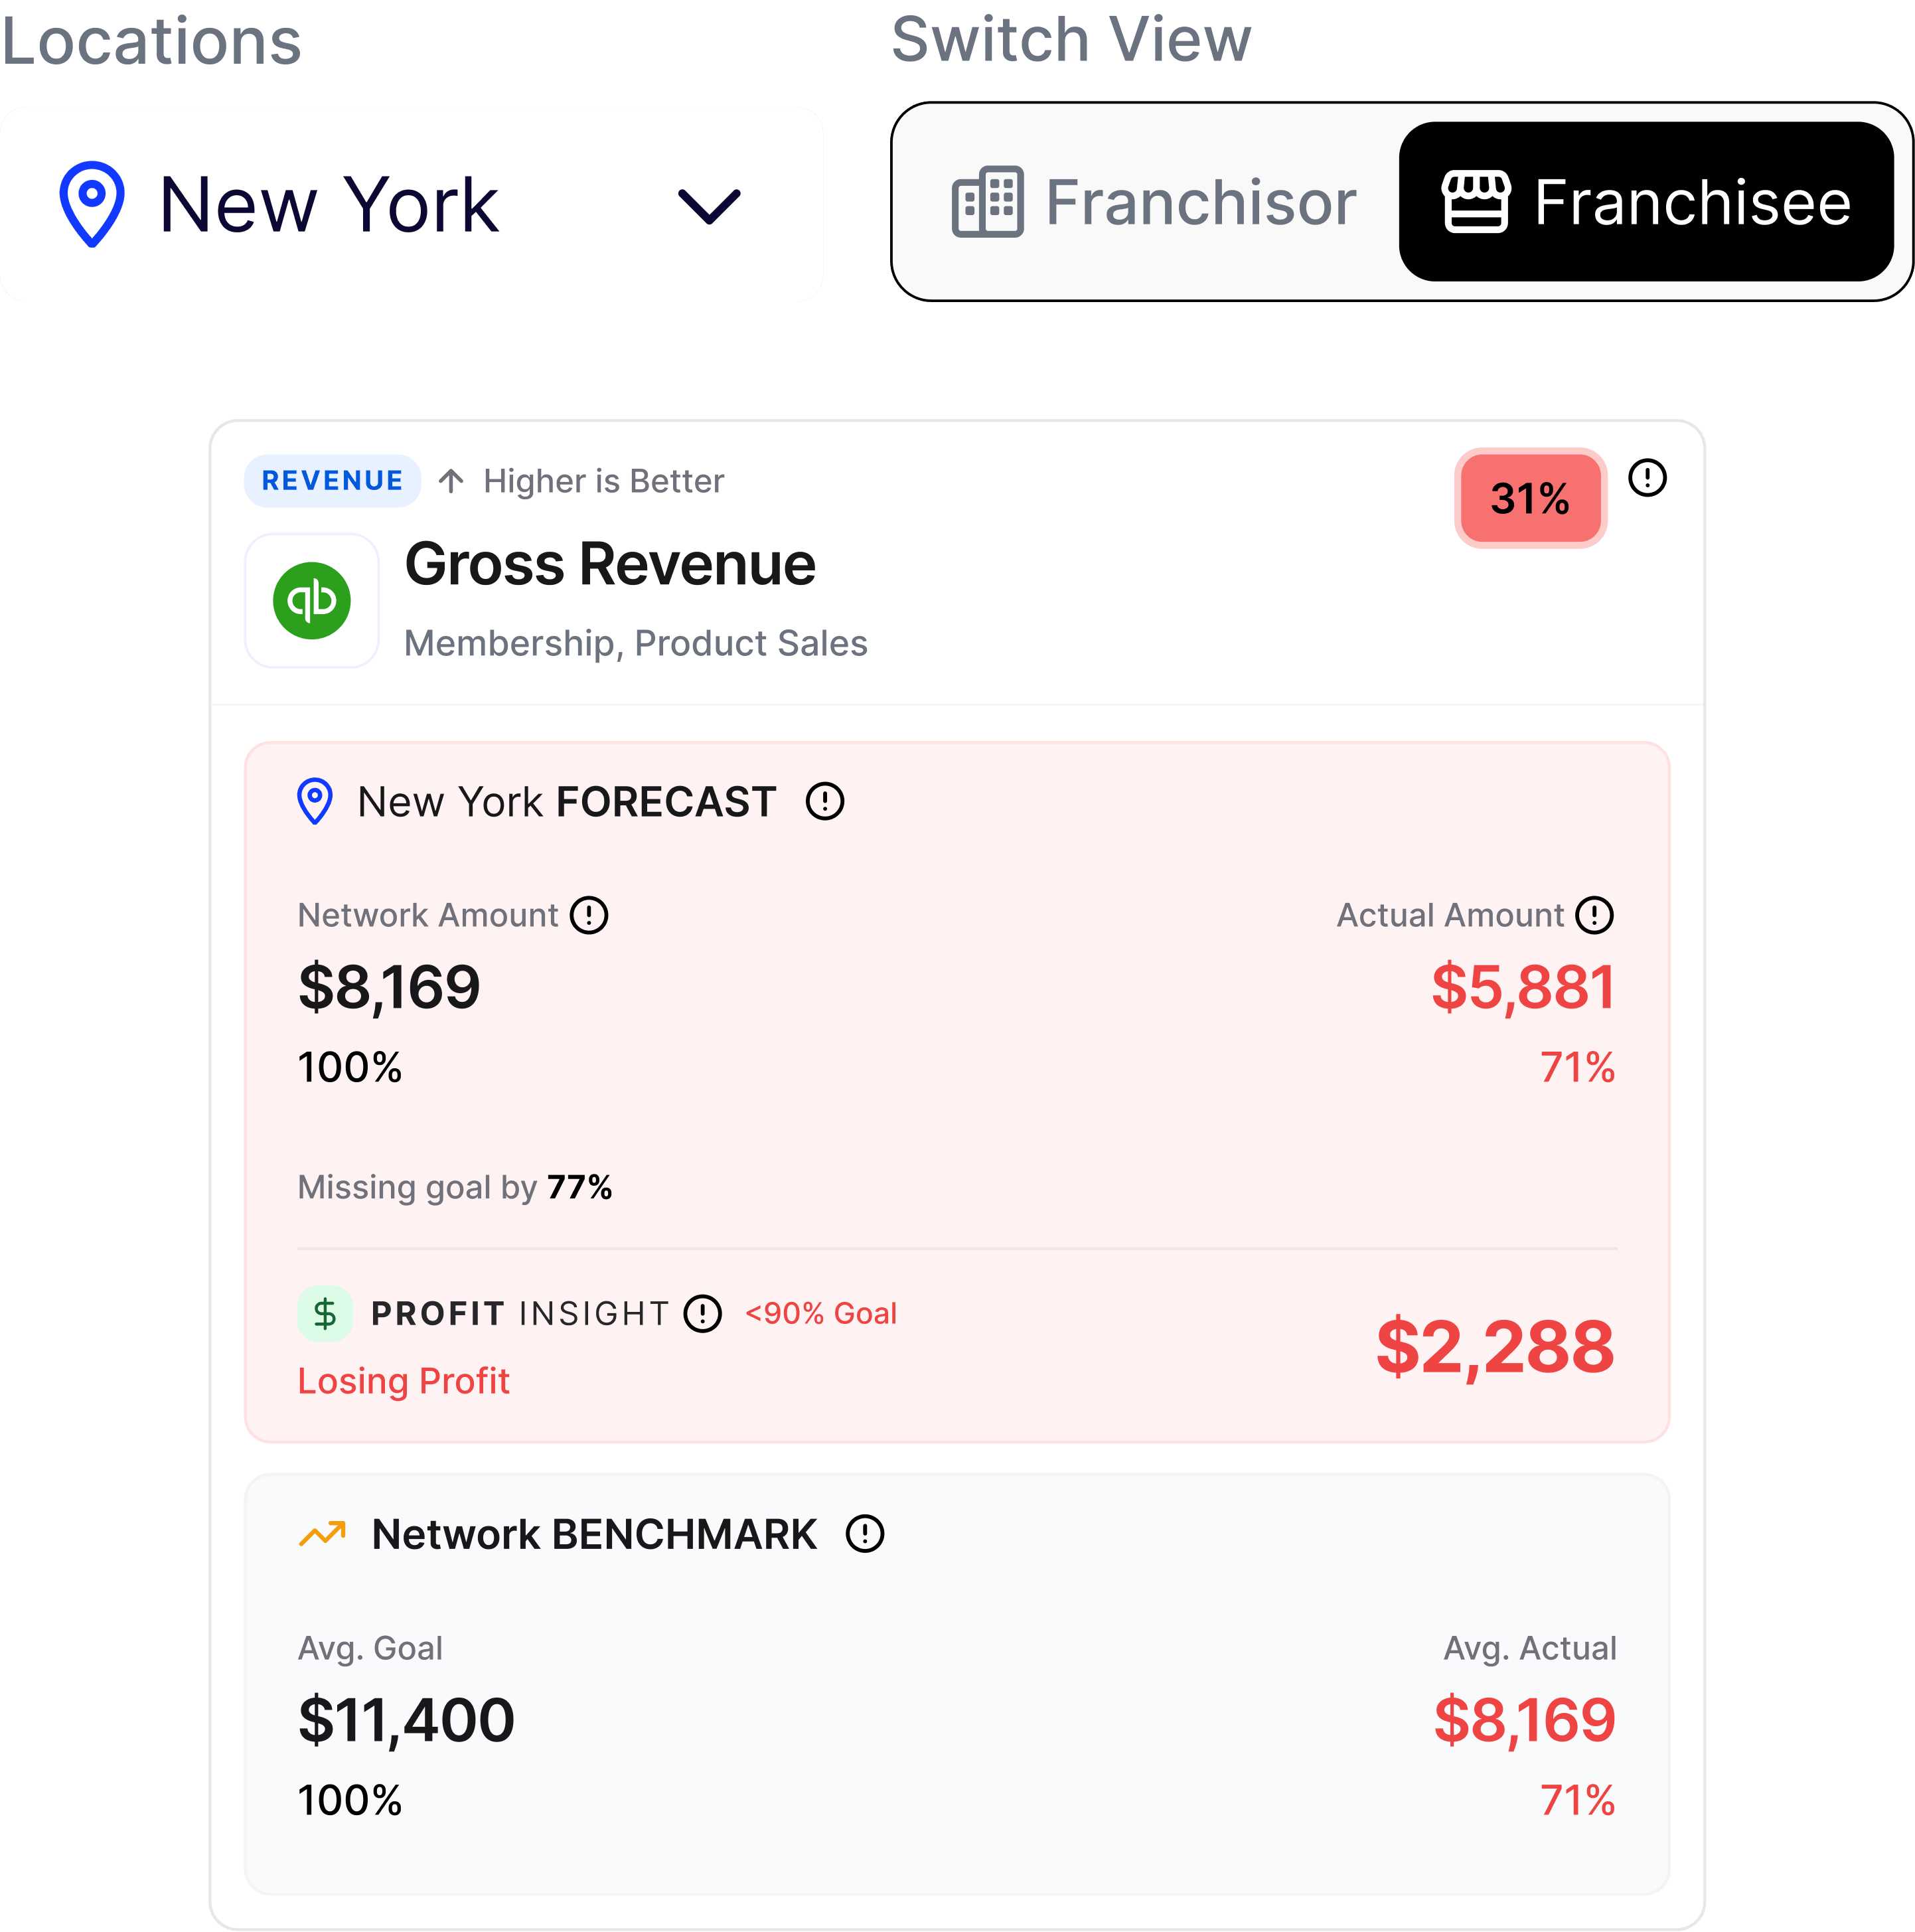
Autymate gives franchisors and franchisees the right level of visibility. Franchisors can review the full network, compare franchisee performance, track profit leakage, and benchmark every location. Franchisees can focus on their own location, see how they are performing against goals, and understand which KPIs need attention.
This role-based scorecard structure keeps data useful, secure, and focused for every user.
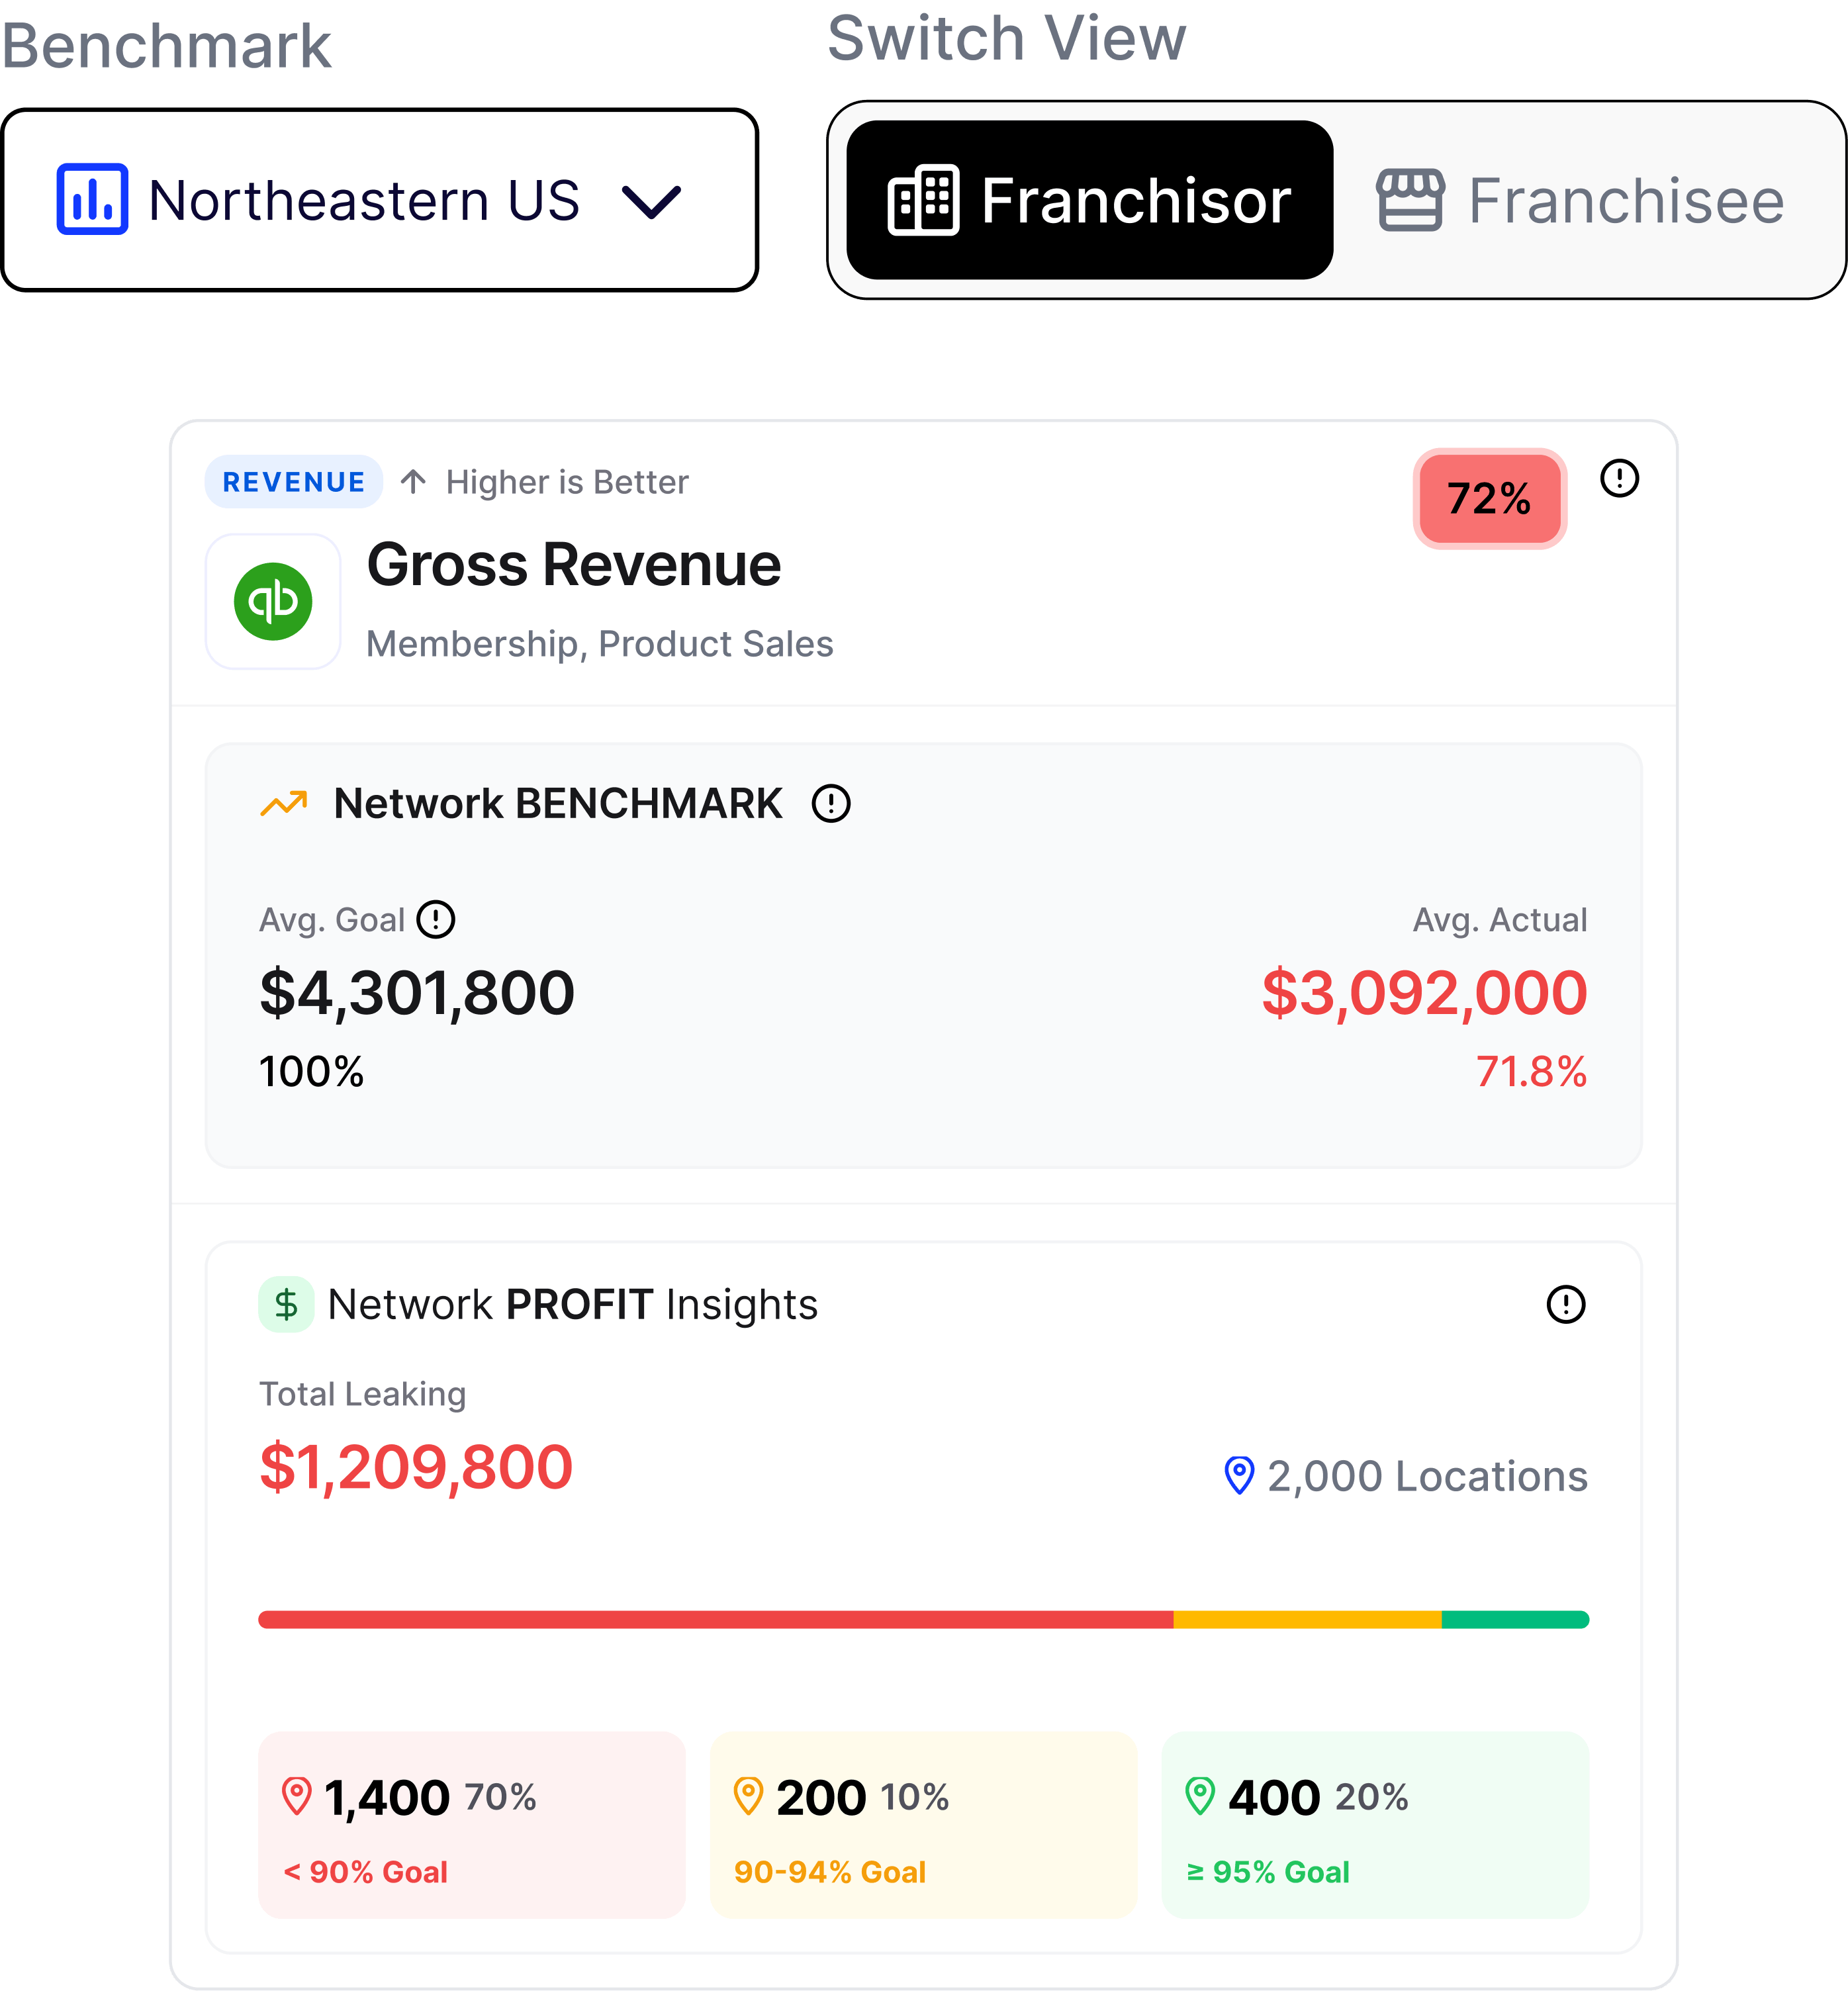
For Franchisors
Track network benchmarking, franchisee rankings, profit leakage, scorecard performance, and AI-powered action plans across every location.
Explore→For Multi-Unit Operators
Compare your own locations, monitor four-wall profitability, track financial KPIs, and identify which stores need support.
Explore→For Franchisees
See your location's performance against assigned goals, review benchmark comparisons, and understand which KPIs need attention.
Explore→
Trust the Numbers Before You Act on Them
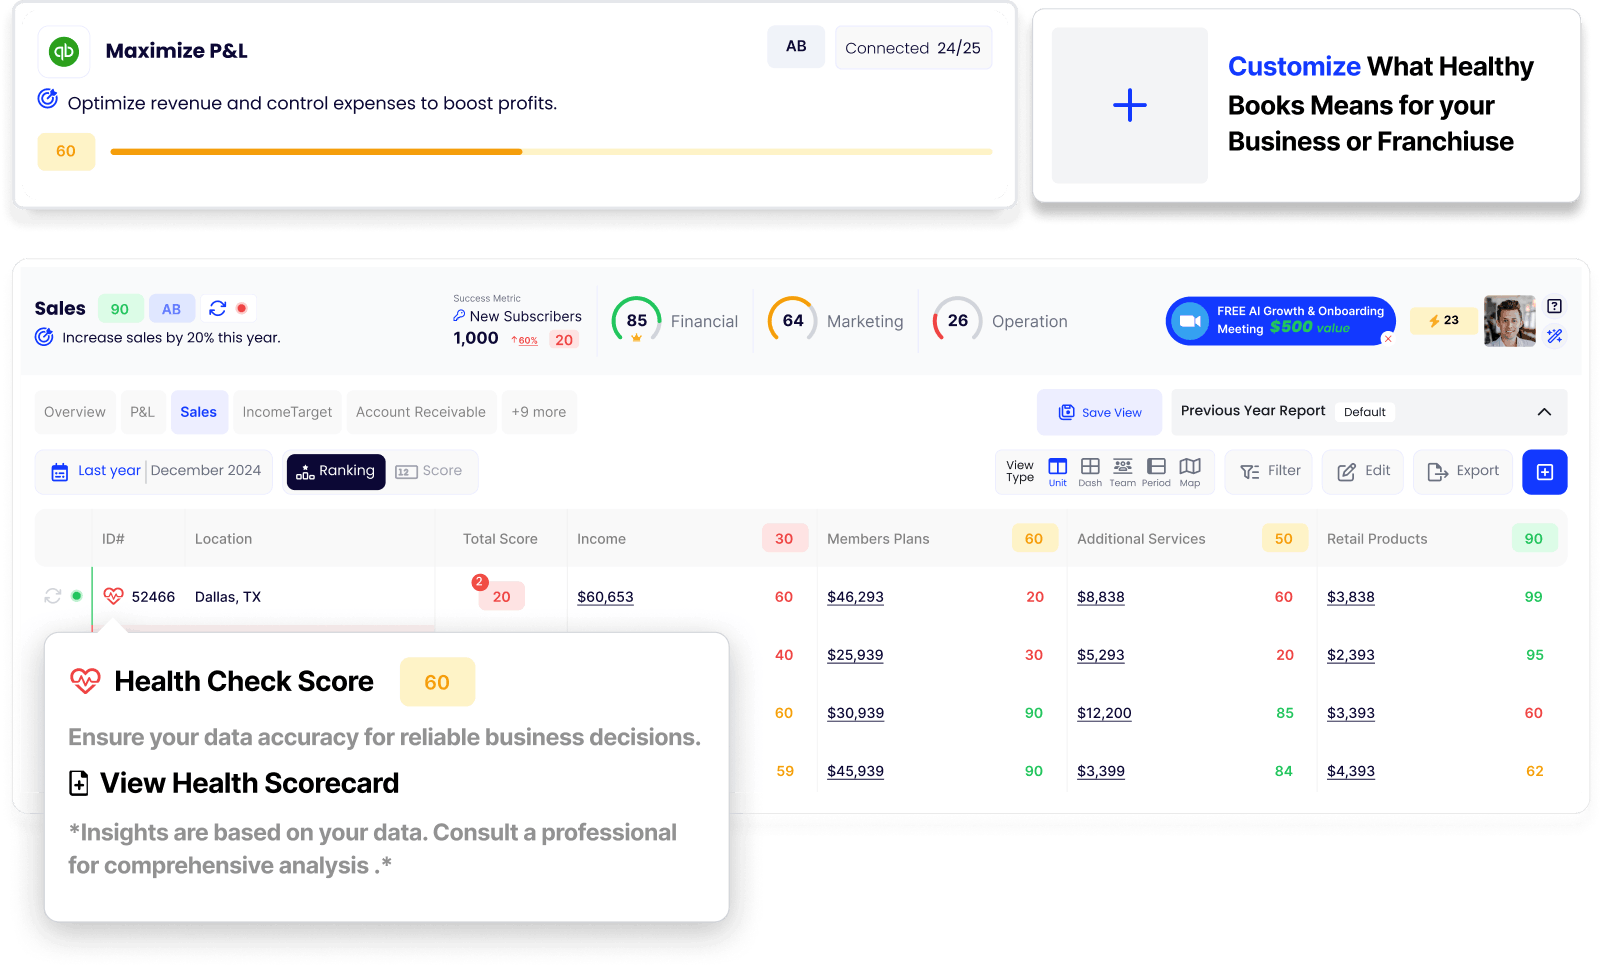
A KPI scorecard is only useful when the data behind it is reliable. Autymate includes data health checks that help teams understand whether QuickBooks and financial data have been reconciled for the reporting period.
Before acting on a red metric, your team can confirm whether the issue is a real performance problem or unfinished bookkeeping. Standardized accounts and connected data help keep every location’s numbers comparable, consistent, and ready for decisions.
Make Accountability a Weekly Habit
Autymate helps teams turn KPI reviews into a consistent operating rhythm. Every metric can have an owner, every red metric can become an assigned action, and every action can be tracked against progress.
Weekly streaks, achievements, and team leaderboards make accountability visible across the business. Instead of discussing the same performance problems every week, teams can see who owns the next step, what changed, and which KPIs are moving closer to goal.
Achievements
Recognize teams and locations as goals are met and performance improves.
Weekly Streaks
Keep review habits visible and encourage teams to stay consistent with scorecard check-ins.
Team Leaderboards
Show which teams, locations, or owners are moving the numbers in the right direction.
Start From a KPI Scorecard Template, or Build Your Own
Autymate makes it simple to launch a KPI scorecard without a long implementation project. Choose a ready-made template for common financial and operational goals, or build your own scorecard by setting a goal, connecting QuickBooks and other business apps, and selecting the exact KPIs you want to monitor.
1-Click Start
Healthy Books
Reconcile accounts, reduce accounting errors, and strengthen financial visibility across locations.
Get Paid
Track invoice-to-cash performance, reduce overdue payments, and improve cash inflows.
Strong Balance Sheet
Monitor assets, liabilities, equity, and balance sheet health.
Grow Sales
Track invoice volume, receipts, transaction size, and revenue activity.
AR Aging
Monitor overdue balances and make sure customers are paying on time.
Maximize P&L
Optimize revenue, control expenses, and improve profitability across locations.
- 1Set a Short and Focus GoalName what the scorecard is designed to improve, such as profitability, revenue, cash flow, or cost control.
- 2Connect QuickBooksBring financial and operational data into the scorecard, from QuickBooks and hundreds of other apps.
- 3Add the Metrics You WantChoose from library metrics, custom KPIs, calculated formulas, or manual inputs.
Self-serve, no demo required. The opposite of a months-long rollout.
Trusted Across Multi-Location Networks
Autymate is built for businesses that need accurate reporting, connected financial data, and clear performance visibility across many locations. Franchise operators, multi-unit businesses, and accounting teams use Autymate to reduce manual reporting, improve data confidence, and track the KPIs that drive better decisions.

Intuit Gold Partner
Verified QuickBooks partner

SOC 2 Type II
Independently attested


1,000+ Five-Star Reviews
Across QuickBooks, Google & Capterra
“Autymate has saved our business so much time and money… Now we know the data is accurate in QuickBooks for all our locations.”
 Jimmy John’s franchise operator
Minuteman Press runs Autymate across 900 locations and cut its reporting workload by 40%.
 Minuteman Press
Frequently Asked Questions
A smart KPI scorecard tracks key business metrics against goals, benchmarks, and targets. It shows whether each KPI is on track, near goal, or behind goal, helping teams understand what needs attention and what action should happen next.
Red means the metric is behind goal and needs action. Yellow means the metric is near goal and should be monitored. Green means the metric is on track or meeting the target.
Franchisors should track revenue, same-store sales, cost of goods sold, labor cost, operating expenses, gross profit margin, four-wall profitability, AR aging, net income, customer activity, location ranking, and goal completion rate.
A dashboard shows data, charts, and reports. A KPI scorecard measures that data against goals and benchmarks. A dashboard shows what happened, while a scorecard helps decide what action is needed.
Yes. Autymate can score locations against defined goals and benchmarks, then flag locations that are behind goal, near goal, or on track.
Yes. Autymate connects with QuickBooks and other business systems to help teams track financial KPIs, monitor reporting accuracy, and compare location-level performance.
Autymate can compare a location against assigned goals, network averages, regional groups, or similar locations. This helps leaders identify top performers, underperformers, and best practices.
Four-wall profitability measures how much profit a single location generates from the revenue and costs it controls, before corporate overhead and royalties.
Autymate can support role-based views so franchisors see network-wide performance while franchisees see only the location data they are allowed to access.
KPI scorecard software is useful for franchisors, franchisees, multi-unit operators, accounting teams, finance leaders, and operations managers who need to track goals, compare locations, and improve accountability.
See Every Location Scored in One View.
Book a 30-60 minute demo and see how Autymate's Smart KPI Scorecard tracks goal vs. actual performance for every location, flags profit leakage automatically, and turns red metrics into assigned actions.
- Every location scored against goal and network average
- Red, yellow, and green KPI status with no manual report building
- AI-recommended strategies assigned to the right person
- QuickBooks and financial KPI tracking in one connected scorecard
- Franchisor, franchisee, and multi-unit operator views